
by Adam Feber
We’ve written a lot of popular topics covering individual funnels of the SaaS customer lifecycle, but it is time to think big picture. How? By bringing it all together and looking at the customer lifecycle as one big funnel. Below is a must read for any SaaS company at any stage. Let’s get started.
To give you a little background, I was recently at a local marketing meetup and someone was discussing how their subscription business’ revenue had become stagnant. Of course, everyone’s inclination was to say they needed to spend more on marketing. But I asked:
- What’s your website visitor to signup ratio
- What are your trial to paid conversion rates?
- What does churn look like?
Turns out, there were other obvious issues. Throwing more money at marketing was a bad idea until the subscription business optimized converting more of the customers that were already coming in and worked on “stopping the leak” through reduced churn. Spending more on marketing would have just been a waste of money until the other items were addressed.
This isn’t the first time that’s happened. While it seems pretty intuitive, when I explain the importance of the whole customer lifecycle funnel, I typically get a response like “ahh, that make so much sense” or “you’re so right, I wish more people understood this.” Which is precisely why I’m writing this blog.
To build a successful SaaS business, whether you are B2B or B2C (but especially B2B), you need to look at the whole funnel and optimize key metrics within each portion to create a well oiled machine that can thrive. Every “unicorn” has mastered the whole funnel, are you ready?
In this blog post I’ll explain:
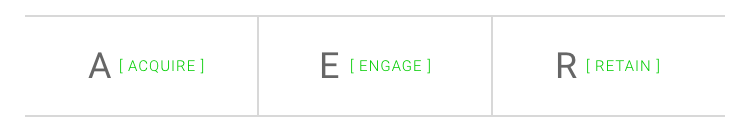
- The 3 main components of the customer lifecycle funnel—Acquire, Engage, Retain
- Common inefficiencies in each section of the funnel
- The individual metrics you should track and optimize for each section of the funnel
- The end results when all departments work together to optimize the entire funnel
Understanding the Customer Lifecycle Funnel
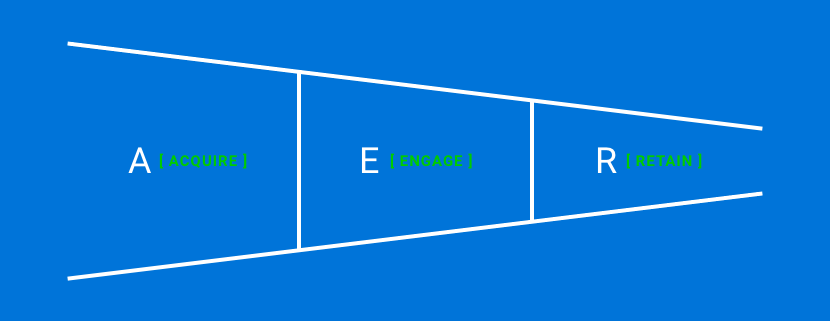
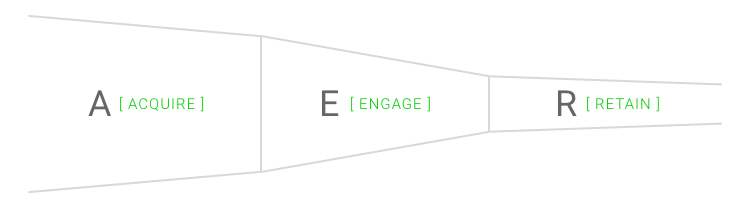
In a perfect world, the customer lifecycle funnel would look like this:
Unfortunately, your funnel will never look like this. Not everyone that visits your site will sign up, not everyone that signs up will convert, and not everyone that converts will remain a loyal customer forever.
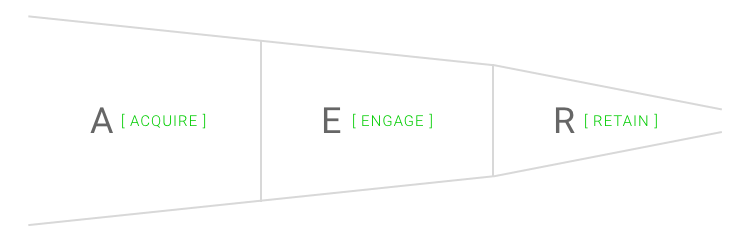
In reality, the funnel [should] looks like this:
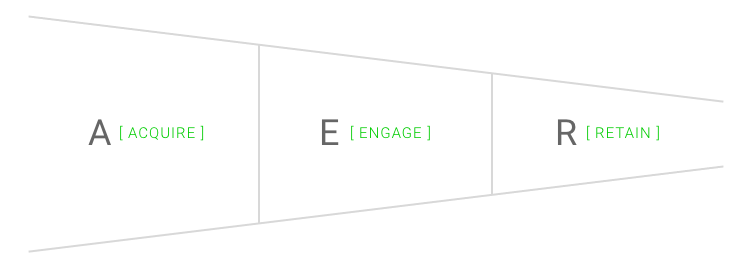
But this isn’t always the case.
If your SaaS funnel doesn’t look like the one above, don’t worry. Keep reading, because below I illustrate common inefficiencies in the funnel. Then I’ll take a deeper dive into each of these scenarios and the metrics you should be looking at:
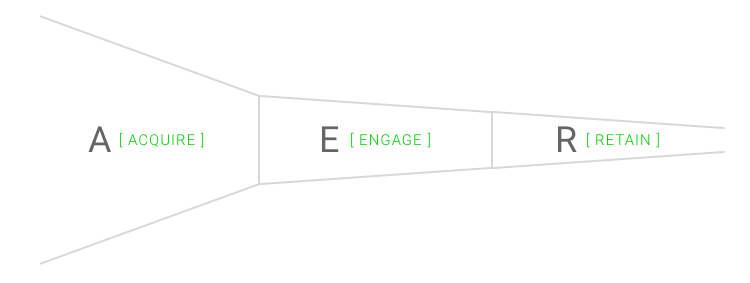
1. Acquire: Bringing in a ton of traffic is great, but it is only truly great if you’re attracting the right traffic that is interested in your product. Tons of traffic and lackluster signups (or whatever conversion event you define) can mean you’re marketing to the wrong customers, there are issues with the product/market fit, or your website lacks perceived value.
2. Engage: You’re getting solid traffic and getting users into the conversion funnel, likely through a free trial. Great! But are they completing mission critical steps to extract value out of your product/service and becoming paid customers? If the answer is “no,” you might have issues with your onboarding. Or there could be a misalignment of your website’s perceived value and the product’s true value which is causing potential customers to abandon ship. Fixing these issues will yield much higher returns from marketing spends so consider it a gift that will keep on giving.
3. Retain: Acquiring new customers is much harder (and more expensive) than retaining existing customers so don’t make the mistake of ignoring the customers you already have! Ideally you want to prevent churn before it happens by providing amazing customer success and support, and identifying red flag metrics to proactively reduce churn.
But sometimes the best way to prevent churn is to understand why people do ultimately churn. Some questions you should be asking at this portion of the funnel:
- Are there key features you’re missing?
- Was service unreliable or buggy?
- Are customers going to a competitor?
- Was customer support lacking?
Find out the answers so you can work towards stopping the leak…
Improve your customer lifecycle funnel through these key metrics.
The takeaway from the information above is that truly successful SaaS companies don’t operate in silos. Marketing, sales, product, customer success, and support are all important pieces of the puzzle, but “winning” requires cross-functional team collaboration to optimize each portion of the customer lifecycle funnel. Monitoring and optimizing the following metrics will help you and your team get one step closer to “unicorn” status.
Each of the metrics below could have an entire blog devoted to it, so my goal here is to highlight some of the key metrics you should be aware of for each portion of the customer lifecycle funnel. This isn’t an exhaustive list and every business is different so there will be other unique metrics that are critical to your own company’s success.
Key Acquisition Metrics
Remember what I mentioned earlier: in the acquire portion of the funnel it isn’t just about driving traffic, but the right traffic. Acquisition metrics help you identify the best sources of traffic and the costs associated with each customer acquisition—both ideal and real. You can compare your ideal and real customer acquisition metrics throughout the lifecycle of your company to ensure you’re optimizing the right marketing channels in order to acquire the best traffic for your product/service!
1. New Visitors: The number of new eyeballs visiting your site.
2. Channel Specific Traffic: You’ll want to measure/track traffic being driven through each channel—direct, referral, organic, social, and paid channels.
3. Total Conversions: How many people complete the conversion events you’ve defined such as start a trial, fill out a form, or download a whitepaper. Be careful not to confuse total conversions for acquisition with paid conversions outlined in engage section below.
4. Visitors to Conversion (or Signup) Ratio: The percent of visitors that complete the conversion event listed above (again, don’t confuse this with conversions in the engagement section below).
5. Customer Acquisition Cost (CAC): CAC is how much it costs to acquire new customers. This can be a detailed formula, but for the “quick and dirty” calculation, “simply add up all of your expenses for marketing and sales last month. Divide that number by the total number of customers you acquired in the same period. This will give you the average amount that you spend for each new customer.” Lars Lofgren (former Director of Growth at KISSmetrics) points out that while the simplified calculation isn’t detailed it does provide “a quick check on the health of your business.”
You should have a benchmark of the maximum CAC you can realistically pay to receive a return on your investment. Calculating your ideal CAC involves knowing other key metrics like average revenue per account, conversion rates, and churn.
Once you’ve determined the ideal CAC for your SaaS business, you can test different marketing mediums. For each medium, if its CAC is below the CAC the calculator provided then you know it is a good CAC number. Keep doing what you’re doing with that medium! If a marketing medium’s CAC is above the ideal CAC, you need to improve these campaigns or move on and test something else.

On to key metrics for the “engage” portion of your customer lifecycle funnel…
Key Engagement Metrics
Engagement is all about onboarding and customer success. The focus is on getting users to complete mission critical steps to become happy, loyal, paying users. After you define the critical engage metrics for your company, you’ll want to take benchmark measurements and then increase those metrics by improving onboarding and communications.
6. First Session Length: The time frame a user interacts with your product in their first session.
7. Returning Sessions/Visit Frequency: How often a user returns to interact with your product or service.
According to Totango, “how often a user returns to your service is a key reflection of the value they get from it.”
Of course, every business will have visitors who sign up and then don’t log back in for days, weeks, or ever. You can use tools like Intercom to automatically communicate with these users and offer assistance to bring them back.
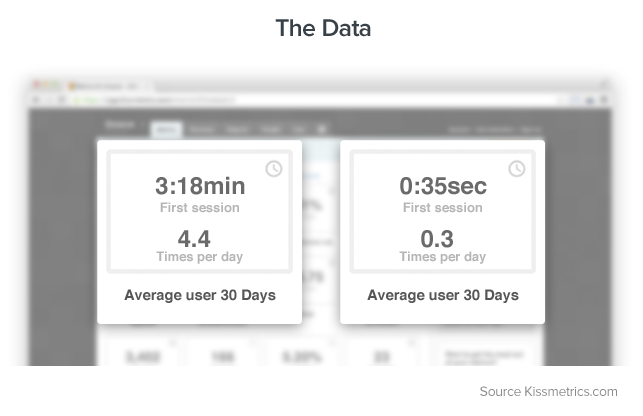
When Groove explored the reasons behind a high trial churn rate they were experiencing, they identified the two metrics above (length of first session and frequency of returning sessions) as the most significant indicators of Groove trial users who were not converting to paying customers. In reviewing the metrics, they discovered “the average user who did not quit after 30 days spent three minutes and 18 seconds using Groove in their first session, and logged in an average of 4.4 times a day. The average user who quit spent 35 seconds using Groove in their first session, and logged in an average of 0.3 times per day.”
They realized they needed to optimize their onboarding communications. By sending “targeted emails to users who spent less than 2 minutes on their first session, as well as to those who (regardless of first session time) logged in fewer than 2 times a day in their first 10 days,” Groove was able to significantly reduce their trial churn. That’s the power of engagement!
8. Core Tasks Completion: These are the core tasks/activities that a user needs to complete to get the most out of your product (one of the most important metrics in the SaaS customer lifecycle funnel!).
Remember what I asked earlier in the blog—are your users completing mission critical steps to extract value out of your product/service and becoming paid customers? Core tasks may be creating a task, uploading a file, inviting a team member, etc. You can use tools like KISSmetrics to create funnel reports to monitor the core task completions:
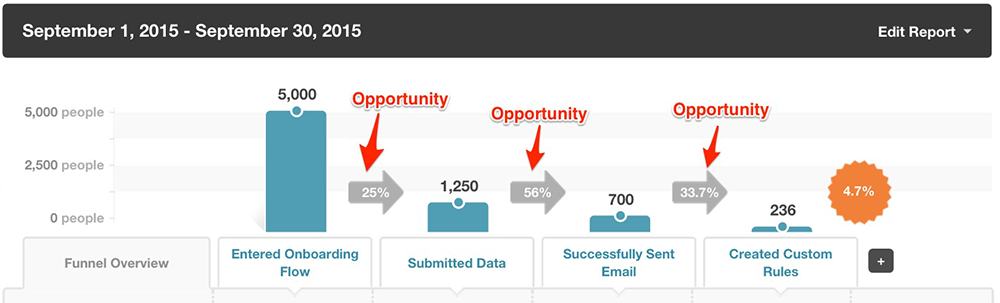
Completing core tasks leads to happy, paying customers. If users are getting lost during onboarding, ask yourself “how can we make completing those tasks more intuitive?”
9. Trial to Paid Conversions: The percentage of trial users who convert to paying customers. This is really what is all boils down to.
Remember, don’t confuse the conversion to paying customers (here) with the “visitors to conversion ratio” in the acquire portion of the funnel. They are two distinctly different metrics.
10. DAU, WAU, MAU: (most basic engagement metrics) “Daily, Weekly, and Monthly Active Users, that is the unique amount of users who are “active” within a given amount of time,” according to Popcorn Metrics’ Paul Boyce.
Most (myself included) see these as vanity metrics, but I’ve included them (lastly) because “comparing the Daily Active Users with Monthly Active Users can be used to indicate “stickiness” which is a measure of how much users are engaging with the product.”
Once you’ve converted users to paying customers, your job isn’t over. You’ve simply moved over to the “retain” portion of the SaaS customer lifecycle funnel…
Key Retention Metrics
Retention really boils down to churn. You already know providing awesome customer success and support are key to retaining happy, loyal customers. Below are a few additional ways to be be proactive and avoid churn.
Define red flag metrics to help identify and retain customers before they churn. Some common red flag metrics for subscription-based businesses include:
11. Activity Churn: Indicated when you see a “drop in usage across an entire team” from previously active users.
“It’s acceptable for one user from a team to disappear temporarily; it’s when the activity of an entire team is dropping that you worry you’re losing a customer,” says Intercom co-founder Des Traynor. A drop in use by an individual team member can simply indicate they’re enjoying a holiday away from work!
12. Cancel Intent Behavior: An action indicating they’re thinking of cancelling such as removing your widget from their website, mousing over the cancel button, or telling support staff they intend to cancel.
Any cancel intent behavior “should trigger appropriate intervention to try to move them back on track toward achieving their Desired Outcome,” writes Lincoln Murphy.
13. Past Due Accounts: A past-due or failed payment attempt is an indication of churn potential.
Dunning is “the process of communicating with customers to collect payment of past due accounts prior to account cancellation.” Effective dunning strategies have been proven to recover potentially lost revenue and reduce churn. Some examples of dunning communications include:
- If their credit card on file is expiring soon
- When processing a transaction fails for various reasons
- If their account is past due, but not cancelled
- Prior to account cancellation if payment is not recieved
Reducing churn is fantastic, but no business can completely eradicate churn. Customers are going to churn for various reasons. The following aren’t metrics, but they allow you gain knowledge from churned customers in order to combat future churn.
A cancel flow is “an off-boarding workflow that allows them to cancel in-app if they want but reminds them what they’ll lose if they do and gives them another, compelling option other than cancelling [such as downgrading to a lower priced plan],” according to Murphy. He points out sometimes just having the option to cancel in-app is all a user needs to feel more comfortable with your product.
I also recommend using exit surveys. Exit surveys can be presented in various ways:
- As the customer hits the cancel button
- As a survey in the cancellation confirmation email
- As a personal call following cancellation
When Groove tested exit surveys with close-ended and open-ended questions, the survey with an open-ended question had dramatically higher response rates. They even found that changing the question from “Why did you cancel?” (10.2% response rate) to “What made you cancel?” (19% response rate) made a significant change in users’ willingness to respond.
Murphy also advises making the survey about them (something like “Tell us about your experience”) instead of a request like “Tell me what we can do better so we can…” which makes it about you.
Once you have churn under control, the key retention metric for growth is Expansion MRR.
15. Expansion MRR: Increased revenue from upsells and cross-sells.
As we explained in a previous blog, happy, paying customers make ideal upsell candidates. Once a customer is fully engaged and has extracted value from your product, they are more likely to upgrade for advanced features and functionality.
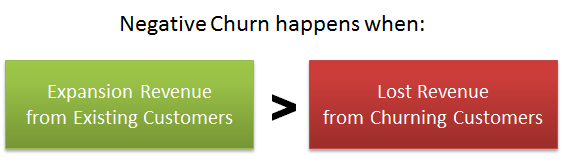
Expansion MRR allows you to work towards negative churn! Negative churn occurs when upgrades and up-sells are greater than what is lost by cancellations and downgrades. Want to learn more about negative churn? Check out this great post from Tomasz Tunguz.
Bottom Line: The Results
Understanding the customer lifecycle funnel and key SaaS metrics is great, but in the end you want to see the results. So let’s look at an example to see what all these metrics look like when improved individually vs as a whole.
Let’s assume a company has:
- 1000 current paying customers at $100/month ($100,000 MRR)
- 30,000 visitors a month to website
- 1% visits to signup ratio
- 5% trial to paid conversion rate
- 5% monthly churn rate
Now let’s assume that all things remaining constant, we improve the following [very realistic] metrics:
- Increase website traffic by 5% each month
- Increase visit to signup ratio by 1%
- Increase trial to paid conversions by 5%
- Decrease monthly churn by 3%
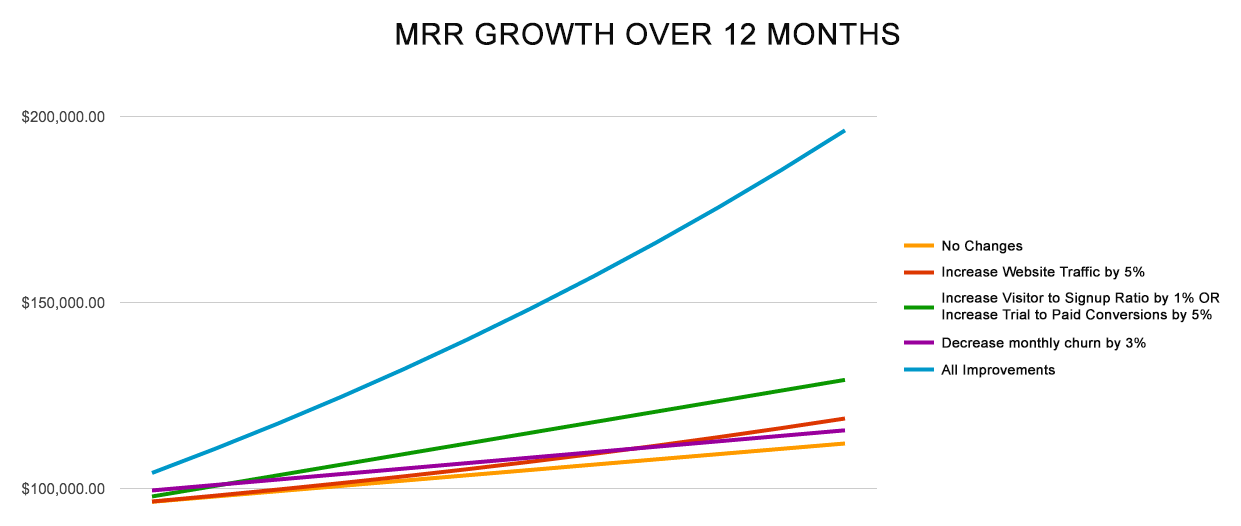
The biggest individual improvement came from increasing the visit to signup ratio by 1% OR trial to paid conversions by 5%—both of these increased MRR by 29.2% over the course of 12 months. But all of the improvements combined almost doubled (96.3% increase) MRR over 12 months!
Please keep in mind that these are simply theoretical numbers, but they are not far off from many SaaS benchmarks you may see. Don’t get hung up on the baseline numbers as much as the big picture: All the individual improvements move the needle in the right direction, but all of them combined have a HUGE impact on revenue growth.
The final takeaway: It is easy to only focus on one portion of the SaaS customer lifecycle funnel, but don’t let tunnel vision distract you from looking at the bigger picture. Directors and leadership must unite to understand all key metrics across the entire funnel. While all the metrics are important to optimize, sometimes your biggest growth levers may not be your biggest priorities—you can change that!
If you want to read more on optimizing portions of the SaaS customer lifecycle funnel, check out these related blogs:


